At the heart of PVWC’s vision is a culture of continuous improvement and transparency based on data-driven decision making and the application of best practices across all facets of our operations. Over the course of 2024 the Executive office has continued to work with each department to develop operational metrics and initial visualization dashboards to make it easier to identify trends in areas of strong performance as well as areas that need improvement. Optimization opportunities are assessed across six (6) interrelated factors: organization, culture, personnel, systems, business processes, and resources. Below is a summary of each department for 2024.
Customer Service: In November 2024, the Executive office started rolling out data dashboards for Customer Service that provide more thorough, accessible and user-friendly analyses of customer engagement/feedback over time. By utilizing these transparent dashboards, the data capture is expected to improve over time and provide more insights into customer experiences, needs and complaints so we can enhance our level of service. A summary of the initial Customer Service dashboard results for 2024 is provided below.
Dashboard: Total Logged/Categorized Calls in 2024:
In 2024 there were a total of 95,104 calls received through Customer Service representatives however only 75,794 (80%) of the calls processed were able to be logged and categorized. Of these logged and categorized calls, the majority involved billing and payment with 42,566 calls received (56%). The most frequent reason for the calls was customer credit card bill payment followed by account inquiry, balance inquiry and billing inquiry.
Dashboard: Total Complaint-Based Logged/Categorized Calls in 2024
Based on the total calls received of 95,104, we estimate that 7,513 (7.9%), were complaint-based calls as derived from a representative sample. However, only 4,307 of these estimated complaints (57%) were able to be logged and categorized. The top categorized complaint for the year was discolored water which accounted for 825 calls (1% of all categorized calls) followed by high bill inquiries and estimated reading inquiries.
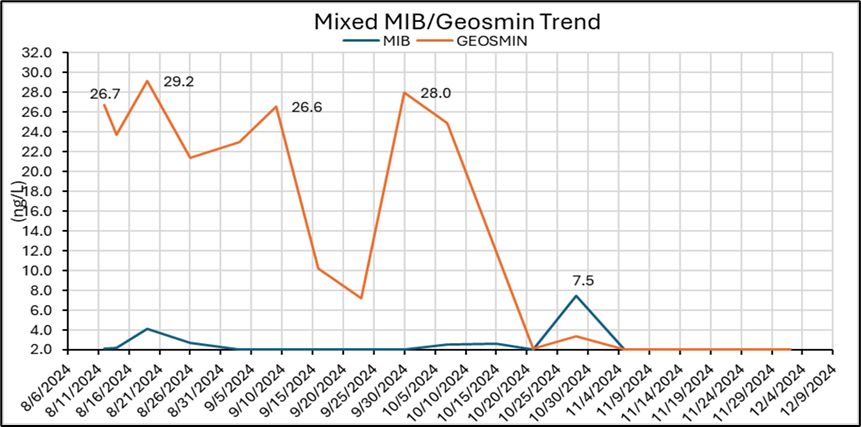
The complaint-based call volume in June was driven by two water main breaks in Paterson that triggered boil water advisories due to loss of pressure. The call volume from July-October was driven by discolored water and taste/odor complaints due to increased concentrations of MIB and geosmin, predominantly from the Wanaque water source. These are harmless, naturally occurring compounds produced from algae that have a musty taste. Issues were also reported with increased chlorine taste due to hydrant flushing progress. As a result, chlorine dosages were reduced to minimize the taste/odor issues while still maintaining regulatory compliance.
Laboratory: During the summer of 2024, the Executive office started rolling out data dashboards for the PVWC Laboratory that provide more thorough, accessible and user-friendly analyses of system-wide water quality over time. A summary of the initial Laboratory dashboard results for 2024 is provided below.
Dashboard: Free Chlorine in 2024:
In 2024 there were 4,348 free chlorine samples collected by PVWC water sample collectors regularly at various locations throughout the entire retail system and processed by the laboratory. This water quality parameter measures how chlorine remains available in the water distributed to customers to maintain the ability to kill pathogens and microorganisms throughout the water distribution system.
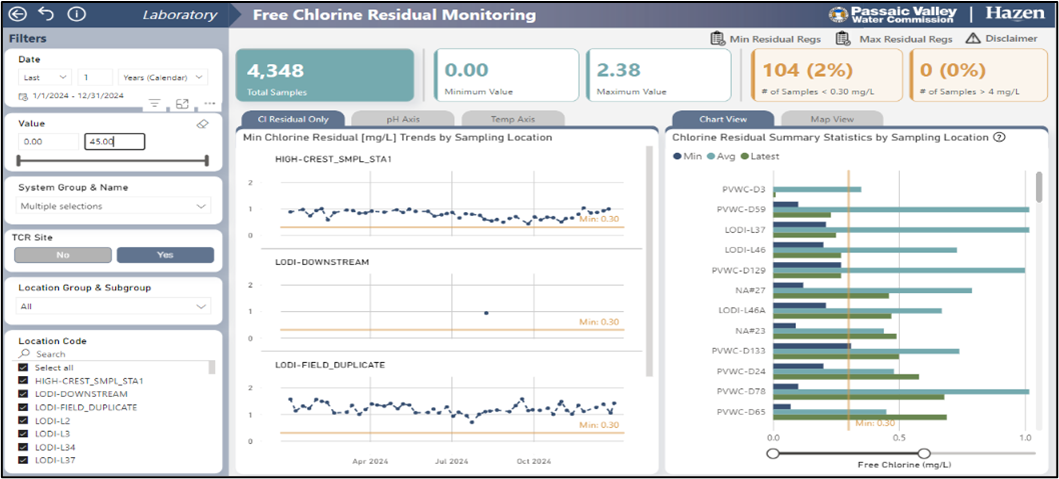
Currently, the NJDEP mandates that a minimum free chlorine concentration level of 0.2 mg/l is maintained in all parts of the distribution system to ensure protection of public health. Based on the new NJ Legionnaires’ Disease Law effective September 12, 2024 a new minimum of 0.3 mg/l has been established with NJDEP and DOH expected to release best practices for water systems by September 2025. Water utilities will have six (6) months from that date, anticipated by March 2026, to implement these best practices as part of a water management plan and submit an annual certification to DEP. In recognition of this new mandate, PVWC has begun to assess locations against both the 0.2 mg/l and 0.3 mg/l free chlorine concentration levels. In 2024 there were 104 samples (2.4%) with free chlorine less than 0.3 mg/l and 35 samples (0.8%) were less than 0.2 mg/l. There were nine (9) samples (0.2%) less than 0.05 mg/l and heterotrophic plate count (HPC) coliform tests were performed, all with negative results. Local hydrant flushing was also performed as well as revisiting sampling protocols to ensure the line is flushed and is representative of water in the main. The maximum concentration for the year was 2.38 mg/l, below the mandated maximum of 4 mg/l.
Dashboard: Disinfection Byproducts in 2024:
Another key water quality parameter regularly sampled by PVWC water sample collectors is disinfection byproducts (DBPs) with regulated amounts for total trihalomethane (TTHM) not to exceed 80 ug/l and for haloacetic acid (HAA) not to exceed 60 ug/l due to linkages to increased cancer risk with long-term exposure. There were 85 samples taken for TTHM in the retail system in 2024 with none exceeding the maximum amount. There were 42 samples taken in 2024 for HAA with none exceeding the maximum amount. The ozone treatment process used by PVWC is the main reason for 100% compliance due to the destruction of raw water organic material that can lead to DBPs when mixed with chlorine.
Distribution and Maintenance: The Executive office is still in the process of developing data dashboards for these departments similar to what has been done for Customer Service and the Laboratory. The dashboards are expected to be rolled out in Q1 2025. Until these dashboards are available we have been gathering data each month in spreadsheets to give insight into workload and performance. The tabulated metrics for 2024 are presented below followed by a narrative summary.
Annual hydrant flushing began to ramp up in March, however due to the water main breaks in Paterson in June and July, and the drought warning issued Statewide in November, flushing production was impacted resulting in 70% of the hydrants being addressed. PVWC staff still performed quarterly flushing for select areas with chronic water discoloration issues caused by the age and material of the water mains. Almost 9% of the hydrants required repairs mainly due to vehicular impact.
There were 116 water main breaks in 2024 with inhouse staff addressing over 90% of the locations. Contractor staff are called in if it is an extremely complex situation (e.g. the June 2024 water main breaks in Paterson) or if in-house crews cannot keep up with a high volume of concurrent breaks. As the Distribution department has staffed up, more work has been insourced, as warranted. Almost two-thirds of the breaks occur during the cold weather months due to low temperatures causing the ground to expand and metal pipes to contract increasing the pressure on old pipes by a factor of 2-10 times normal. During warmer months there are some spikes observed in water main breaks mainly due to illegal hydrant usage associated with paving activities or authorized hydrant usage during street sweeping or fire emergencies that can cause breaks if the hydrants are not carefully shutdown after use. The average industry metric is 20-30 breaks/100 miles. In 2024 PVWC had 17.8 breaks/100 miles which tracks closely to the industry average. The value of the water lost due to hydrant flushing and water main breaks is estimated at $8M/year. PVWC is ramping up a water main replacement program to begin to address issues with chronic breaks in certain areas as well as discolored water issues.
There are approximately 65,000 curb boxes on PVWC customer service lines that are used to isolate localized areas in the event of emergencies for water main breaks or fires; or for chronic delinquent account shutoffs and abandoned properties. Many of these boxes have been buried over the years through paving activities or other construction and are required to be excavated to function properly. In 2024 inhouse crews excavated 950 curb boxes to support fire departments and ongoing PVWC operations. In May, our production in excavating curb boxes doubled and tripled for the rest of the year compared to the first four months. This is due to the addition of a sixth (6th) crew to focus on the effort. Toward the end of the year a new Vactor truck was delivered that will further increase productivity allowing work to be accomplished in less than one (1) hour compared to a half-day that it currently takes due to the labor-intensive effort. This will free staff up for other activities related to hydrants and water mains and further insource work currently contracted out.
There were almost 27,000 mark outs of PVWC underground infrastructure performed by Distribution staff to support local development and street construction as well as protect PVWC assets. Over 1,700 (6.1%) of these mark outs were due to emergency work requiring a 4-hour response time. The remaining 24,842 regular mark outs require a PVWC response within three (3) business days. The high volume of work, short response times, and weather impacts make this a challenging operation that generated 2,000 hours of overtime last year. There were also over 3,300 meter changes performed by staff in 2024 which is almost 5% of the system-wide meters. At this annual production, the lifecycle of meters would be on the order of 20-25 years and many existing meters are already 10-20 years old. As a result, we will be advertising water meter replacement contracts to catch-up with older meter replacements as well as take advantage of principal loan forgiveness currently available through the State Intended Use Plan (IUP) estimated at $7M/year.
Finally, the Maintenance department initiated over 2,400 work orders for preventative and corrective maintenance in 2024 and completed almost 1,900 (76.3%). With the ongoing implementation of a new Computerized Maintenance Management System (CMMS) additional preventative maintenance work orders are being programmed to consolidate activities under Maintenance that were previously performed by other departments. This will ensure centralized accountability to get work orders addressed. This work order production is in addition to the project-specific work that was also accomplished by Maintenance for the construction of the improved drainage system at New Street Reservoir and the rehabilitation of the Lamella tubes in Train #2 of the Actiflow process at the Little Falls WTP.
Purification: PVWC continued to provide high-quality water in compliance with State and Federal regulations to all customers in 2024. The Executive office is still in the process of developing data dashboards for this department similar to what has been done for Customer Service and the Laboratory. The dashboards are expected to be rolled out in Q1 2025. Until these dashboards are available we have been gathering data each month in spreadsheets to give insight into workload and performance.
One issue that can occur during the summer as referenced in the Customer Service section, is the spike in complaints regarding a “musty” or “earthy” water taste in some areas. MIB and geosmin are naturally occurring compounds in source surface water that have an earthy taste and odor. Since August we have been experiencing higher concentrations in our mixed-supply, post-treatment due to the water provided by the Wanaque filtration plant. The plant does not have granular activated carbon and instead relies on treatment with PACL to remove suspended solids and turbidity. Due to above normal temperatures and drought conditions the high concentrations have lasted for several months causing a spike in taste, odor and color complaints. Since late October concentrations have trended down. PVWC staff had been meeting weekly with NJ American Water and NJDWSC staff to discuss ways to mitigate the situation.
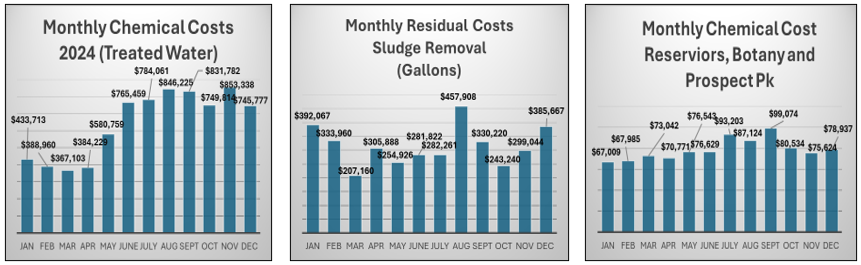
Another impact from the unusually dry summer is the raw water quality in the Passaic River at the intake of the Little Falls treatment plant. The unusually low flow conditions result in more of the river water being generated by upstream wastewater discharges. This requires an increase in chemical dosages at the plant to remove higher solids which also increase sludge production and adds cost. This is something PVWC operations staff monitor closely and adjust chemicals and sludge hauling in real-time as warranted. Chemical costs are the largest operational expense at the treatment plant totaling $8.7M in 2024 followed by sludge removal totaling $3.8M.
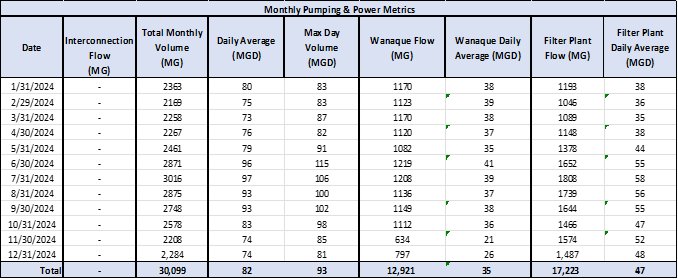
Pumping and Power: The Executive office is still in the process of developing data dashboards for this department similar to what has been done for Customer Service and the Laboratory. The dashboards are expected to be rolled out as part of a next phase of development. Until these dashboards are available we have been gathering data each month in spreadsheets to give insight into workload and performance. The tabulated metrics for 2024 are presented below with a narrative summary.
There were no interconnection flows made in 2024. NJDWSC initiated construction on November 4, 2024 on their Wanaque water treatment plant sedimentation basins. PVWC curtailed flow from Wanaque to 20-30 MGD until construction was completed on November 22nd. We are in the process of replacing many analog components of the pumping system, which are increasingly difficult to source, with digital relays. A capital project for the cone valve replacement is also being initiated due to the age of the station. Certain components are nearing 125 years old and we will be developing a plan for a replacement pumping station in the next few years.
Engineering: The Engineering department was reorganized in July 2024. The organizational changes being implemented are a result of a collaborative assessment of the Board-approved, $809M 5-year capital plan - the largest capital program ever undertaken by PVWC. The goal of the reorganization is to optimize PVWC capital planning and budgeting efforts while continuing to focus on improving our project delivery capabilities. This will allow PVWC to focus staff resources and better meet the needs of the water supply, treatment and distribution systems to the benefit of the communities we serve. The following sections were created as direct reports to the Executive Director:
- Planning and Modeling Group: focused on PFAS treatment at the LFWTP due to new Federal regulations with compliance by 2029; storage and distribution planning due to administrative consent order requirements; dam assessments; electrical system assessments; capital budgeting; GIS management; development and management of distribution and treatment models; developer permit applications review; and NJDEP permitting and water quality accountability act (WQAA) submittals.
- Capital Project Delivery – Treatment and Reservoirs: focused on design, construction, construction management and commissioning of capital projects including the $41.8M Levine Reservoir Storage Tanks and the $45M (estimated) Residuals Handling Upgrade along with the other projects highlighted in the Capital Program section of this report.
- Capital Project Delivery – Distribution and Resiliency: focused on the ongoing $29.5M lead service line replacement project, capital water meter replacements, transmission and water main upgrades, resiliency projects for flood mitigation, contract site/paving restoration, and emergency contracts for on-call services for water main repairs.
The division of labor described above still operates within a collaborative, coordinated framework with each section working together. Given the scale and scope of the PVWC capital program the focus of each group on critical parts of the overall program will allow PVWC to get projects done. Through robust planning and efficient project delivery we will effectively drive PVWC capital investments. Preliminary dashboards for construction projects are already available on our website and will be further developed.
Information Technology: The Executive office has been working with the IT department to develop tracking dashboards for IT assets across 40 sites including the Little Falls campus and Clifton headquarters impacting 63 asset groups such as pumping stations, storage tanks, chemical addition facilities and treatment processes. The goal is to identify and mitigate system vulnerabilities and improve operations. In addition, we have assembled an internal cybersecurity council to develop policies and procedures including data governance; rolled out internal controls on user behaviors; initiated design standards for use by capital projects; and begun outreach to other utilities to share best practices and lessons learned. We continue to work with the Dept of Homeland Security (DHS) and the NJ Cybersecurity and Communications Integration Cell (NJCCIC) to assess our systems and upgrade as warranted. Developing a strategic road map for our IT infrastructure will be a focus in 2025.
Purchasing: Towards the end of 2023 and continuing into 2024, the internal PVWC procurement process was changed to a centralized model with the Purchasing department controlling the entire process. Each department now supplies subject matter experts to have input on technical specifications and scopes of work and to participate on selection committees for professional services and competitive proposals. Concurrent with this change we have modified our scopes of work for consultant solicitations and introduced a more rigorous evaluation process to ensure equity. In addition, formal vendor and consultant performance evaluations have been ongoing to document good work and identify areas requiring improvement. All these organizational changes were needed to ramp up for the sharp increase in the capital program due to regulatory requirements and the age and condition of PVWC’s infrastructure. Purchasing tracks changing State rules and DCA requirements governing purchasing activities including conflict of interest; and small- or minority owned-business outreach. Finally, Purchasing staff work closely with each department on invoice control and billing with over $300,000 of errant bills corrected in 2024, a significant savings for PVWC. The department is getting more focused on key performance indicators and metrics in 2025 with dashboards to follow.
Organizational Development and Human Resources (ODHR): The goal for ODHR is to collaboratively develop PVWC as a modern water utility providing high levels of service by attracting, developing and retaining talent throughout the organization. Transitioning the organization to a different timekeeping system in 2023 continued to pay dividends in 2024 by streamlining the timesheet process and allowing data to be more easily accessed. PVWC has expanded full-time headcount from 210 in 2022 to 245 by the end of 2024. Based on an analysis done in the Spring of 2024, over 40% of our staff live in the owner cities and almost 67% live in Passaic County. The department is getting more focused on key performance indicators and metrics in 2025 with dashboards to follow.
Finance:
Over the last year the Finance department, in collaboration with the IT and Purchasing departments, has been focused on vendor selection to modernize PVWC’s payment processing system (currently an amalgamation of various vendors and systems) and the financial management system. These two distinct efforts involve different industry vendors due to the unique function of each system. The existing systems are obsolete and require capital investment for replacement and modernization. Vendors have been selected and contracts awarded for each effort and the development and implementation process will commence in 2025. Successful implementation will allow for much easier access to financial information along with dashboards for critical metrics on a regular basis.